In this blog post we will be analyzing some data about the media in regards to political biases.
First we can see on the left side shows “The News Media” and how they rank on an individual scale as independent news outlets, whereas the right side shows the rating of how citizens rank their news/media sources and how they feel they should be on the scale.
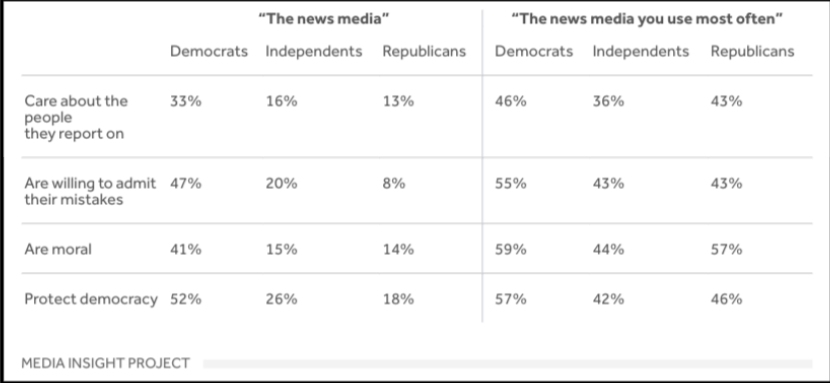
The first, trend we will be acknowledging pertains to the Democrats on both sides of the graph, we can see that in both “The news media” and “The news media you use most often” the Democrats remain the highest percent in all questions. We can specifically see this when the chart shows us regarding the question of whether or not the party is moral we can see that the Democrats went from 41% to 59% which is almost an 11% increase which is pretty significant.
Another, Trend that stands out is that on the right side whose demographic is about “The news media you use most often” illustrates that every Political Party on the graphs percentages are seen skyrocketing we can most closely see then when the graph states the republicans had 14% on the question of are they moral they jump to 57% which is a 43% increase which is a extremely drastic change for originally being so low
 Deconstructing Politics in America